Analyzing wheat farming with nitrogen fertilizers and inhibitors to optimize nitrogen use

The examination of primary fertilization approaches in wheat cultivation by implementing fertilizers with nitrification inhibitors for economizing the nitrogenous fertilization
Shaked Kochva (shakedk@shaham.moag.gov.il), Field Service, Extension Service, Negev Region, Ministry of Agriculture, Israel.
*A list of the main researcher’s colleagues is attached
Introduction
In many field crops in the northern Negev region in Israel and in the coastal plain region, there exist sand patches and seashore limestone (kurkar), which extend over tens of thousands of dunams in an irregular form. This soil texture leads to a high variability and a reduction in yield. From a research using pots, carried out in 2020, it was shown that nitrate leaching into the lower parts of the soil profile is the cause of the above-mentioned yield reduction (R. Erel, 2021).
The aim of this research was the development of a fertilization approach which will reduce nitrate leachings into the deeper parts of the soil profile and thus will increase its accessibility to the plants. To fulfill this aim, the utilization of fertilizers containing nitrification inhibitors and a split-fertilization approach, were examined. All treatments included an identical nitrogen dose of 10 Kg Pure Nitrogen per dunam. The treatments carried out were :
1) Control;
2) Urea as a preplant dress;
3) Urea in a split fertilization (into Preplant and 1X Topdress) treatment;
4) Urea in a split fertilization (into Preplant and 2X Topdress) treatment;
5) Urea ‘Blue’ as a Preplant fertilization treatment;
6) Urea ‘Blue’ as a Preplant and Topdress fertilization treatment;
7) Urea ‘Green’ as a Preplant fertilization treatment;
8) Urea ‘Green’ as a Preplant and Topdress fertilization treatment;
Treatments 5 through 8 included nitrification inhibitors.

An aerial photograph of the experiment area at Yad Mordechai, taken from a drone, flying from east to west (yellow arrow points westward). The photograph shows the variability of the different experimental blocs in the area. It can be clearly seen that in blocs ‘A’ and ‘B’ (on the west side) there is no difference between the ‘Control’ treatment (without fertilization), in comparison to other treatments. In blocs ‘E’ and ‘F’ (on the east side), it is possible to view the Control treatment, where the growth is inhibited, also in the central blocs (blocs ‘C’ and ‘D’).
The experiment was planned and carried out in a ‘Random Block’ design in six replicates, in light soil plots close to kibbutz Yad Mordechai, at the southern part of the coastal plain region, in Israel. The precipitation quantity (rainfall) in this region amounted to 550 mm of rain (Table no. 1).

Table 1 . Total rainfall (mm), per month, measured at Yad Mordechai Region during the wheat growing season.
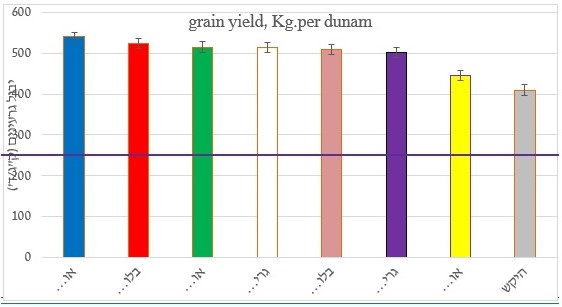
It was evident that in part of the replicates of the ‘Control’ treatments, the growth pattern of the wheat plants was inhibited, but in soil and plant examinations carried out in these plots, there was no viable indication of the nutritional state of the wheat plants that could be reached. It can be seen that the split fertilization treatments and the fertilizer treatments which contained nitrification inhibitors, produced a significantly higher grain yield (ca. 520Kg grain per dunam) than the Urea treatment, given as a Preplant treatment (445 Kg grain per dunam) and the Control treatment (410 Kg grain per dunam).
Discussion and conclusions
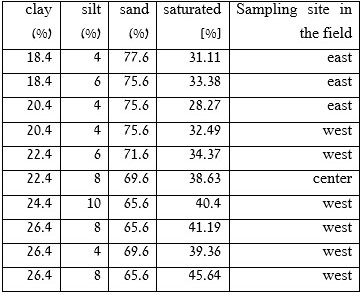
The soil texture is a very important parameter in the plant’s ability to acquire nitrogen from the soil. The more ‘light’ (e.g., sandy) is the soil, the more nitrogen is leached to deeper strata of the soil profile and more rapidly so. The plot chosen for the experiment contained different soil types, e.g., with a high clay content on the west side of the plot where there were no differences between the different treatments, whereas the blocs on the eastern side of the plot contained less clay and contained more sand. And thus, the growth of wheat plants at the ‘Control’ blocs was inhibited, probably, as a result of a lack of nitrogen supply. The plot’s mechanical composition (%) and saturation degree (%) are shown in Table 2. From the data presented in Table 2, it is evident that the clay percentage rises from east to west.

Table 2 :% saturation and mechanical composition of the experimental plots .
One conclusion which can be drawn from the results presented in Nitrogen analysis results, presented in Fig. 3, are also ambiguous, concerning the true nitrogen state of the wheat plants. The general nitrogen content in the wheat plants diminished in all plants, according to the standard development of the wheat plants. This makes it difficult to conclude whether there is a lack of nitrogen in the plant. In Table 5, it can be seen that the nitrate concentration 26 DAS (phenological age of 3 leaves), is the lowest in the ‘Conrol’ treatment, which testifies on a lack of nitrogen, compared to other treatments.
In Figure. 1, where the general grain yield is shown, it is evident that in the ‘split Urea’ treatment and in treatments with nitrification inhibitors, the yields were the highest. This, in comparison to the ‘Urea’ Preplant treatment and to the ‘Control’ treatment. This datum is important and testifies on the need to split nitrogen doses during the growing season. From an analysis of the rainfall regime (Table 1) during the growing season, being exceptional in comparison to common winters – above 200 mm rainfall in the first month, about 40% of the total rainfall in this area it seems that an exceptionally strong nitrate leaching occurred, which had a detrimental effect on germination and on root development. No doubt that under such conditions in sandy soils, there is a significance to split fertilization, even in ‘Urea’ with nitrification inhibitors. If one fertilizes with nitrification inhibitors, it is possible to fertilize with a full dose of the Preplant treatment and to acquire a yield similar to the yield acquired in ‘Urea’ as a double-split fertilization treatment. It is reasonable to hypothesize that the inhibitor activity supplied nitrogen to the active root system till the end of the growing season.

Figure 1 : wheat (cv. ‘Kitain’) grain yield (kg. per dunam), per treatment.
Histogram Legend, from right to left (horizontal axis):
Histogram number (color):
1. (grey) : ‘Control’ ;
2. (yellow) :’Preplant: Urea’;
3. (purple) :’Preplant-Green’;
4. (light purple):’Split 2X-Blue’;
5. (white): ‘Split 2X-Green’;
6. (green): ‘Split 2X-Urea’;
7. (red) : ‘Preplant-Blue’;
8. (blue) : ‘Split 3X-Urea’;
Vertical axis denotes wheat grain yield in kg per dunam.
The percent protein mean content (10.3%) and the percent ‘wet’ gluten content (17%) were very low in all treatments, to the point of disqualifying the wheat yield for marketing. These data point to the fact that the nitrogen rations in all treatments examined, were in a short supply. A low protein percentage in wheat grains and the differences between treatments, are not significant. Even in the ‘Control’ treatment without fertilization, the nitrogen content was high in comparison to the split Urea + nitrification inhibitor treatment and to the standard Urea treatment, where the Urea treatment in three replicates and the Preplant Urea ‘Blue’ treatment, were a bit higher than the ‘Control’. However, the high protein yields occurred in the Urea treatment which was split into three applications and in the Urea Blu fertilization (Preplant and split), where the lowest protein content in the yield occurred in the ‘Control’.
It seems that the data collected during this experiment from the soil and from the plant did not testify on a nitrogen shortage during the critical stages of the crop development, so that it will be possible, to our mind, to be able to respond accordingly, and try to reach full potential from the crop, concerning the grain yield or the wheat grain quality.
Acknowledgements: This study was partially financed by The Israel Association of Field Crops Growers.


