Tracking Agricultural Phenology in Northern Negev (Shikma Farm) with VENµS Satellite
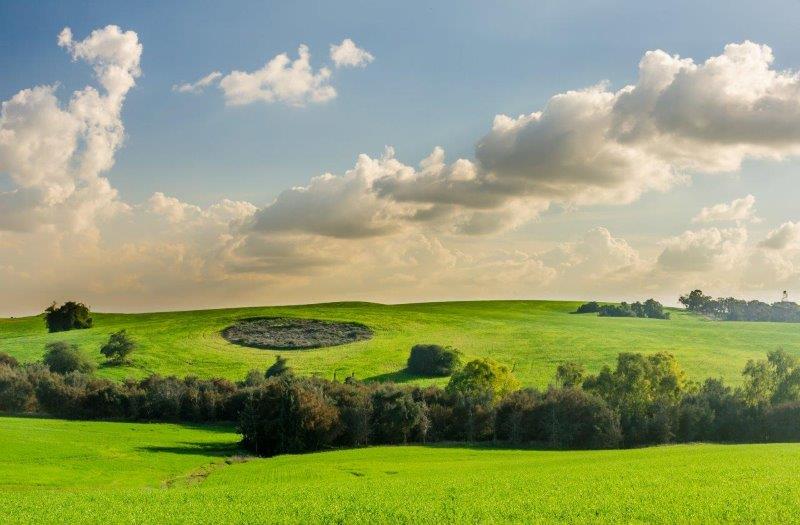
Photo by Odi Tzuri, Shaar HaNegev
Arnon Karnieli (karnieli@bgu.ac.il), The Remote Sensing Laboratory,
Jacob Blaustein Institutes for Desert Research Ben Gurion University*
Summary
Remote sensing technology makes it possible to acquire information on objects on the globe by intercepting electromagnetic radiation that is reflected or emitted within different spectral regions using Earth observation satellites. In agriculture, it has become possible to use satellite images to study the plant’s health and characterize different growth cycles to save resources, increase yields and profits, and protect the environment. The Israeli-French research satellite (VENµS) was launched in August 2017 to provide frequent time series of plant characteristics in high resolutions and a constant imaging angle for precision agriculture uses. In this research, the use of a VENµS time series over three years in three different field crops at Shikma Farm (located in Beit Kama, Mishmar Hanegev, and Migda Farm) to characterize the phenological cycles of different crops and to estimate the health and yields during that period. The findings show that it is possible to differentiate various groups of crops to identify variance within the same crop that stems from water stress or pesticides. We conclude that precision agriculture integrated with remote-sensing archives makes it possible to detect anomalies and different patterns in the growth plots and thus make decisions that optimize agricultural farm management.
Introduction
Remote sensing is a discipline that permits acquiring information about objects or phenomena without creating physical contact with them. Remote sensing is practicable in many fields, such as, agriculture, mapping, hydrology, ecology, meteorology, and more. Remote sensing is carried out mainly by using satellites or unmanned aerial vehicles equipped with various sensors capable of differentiating and categorizing global objects by sensing electromagnetic radiation reflected or emitted from these objects. The electromagnetic radiation propagates in the form of waves in space and through the atmosphere in various spectral ranges (Fig. 1). The radiation in the visible range captures only a minute part of the electromagnetic spectrum. Usually, imaging sensors can discern between spectral regions beyond the human visible one, where much data can be implemented for different applications.
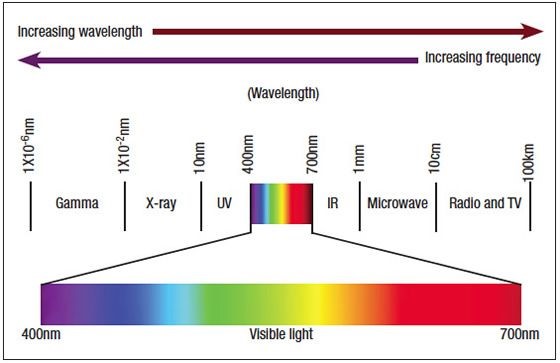
Figure 1: The Electromagnetic Spectrum
All objects on the globe reflect, absorb, and transfer energy that changes according to wavelength. Each object has a specific spectral ‘fingerprint’, making it possible to identify different materials, e.g., various plant species and soils, and diagnose their physiological state. For example, stress states in crops, chlorophyll content, water status, etc. In agricultural practice, it is possible today to use remote sensing techniques to provide current and renewed information about the state of crops during the growing season.
This research used a French-Israeli satellite, VENµS, to acquire multispectral photographs in spatial resolution and high frequency above most agricultural regions in Israel. The satellite photographs provide much information about plants’ health and phenological cycles of crop yields in the fields of Shikma Farm. The general aim is to examine new algorithms in advanced precision agriculture. From the economic and ecological point of view, the principle of precision agriculture can help growers economize on crop expenses, increase profits and defend natural resources and environment qualities, like soil and deep water.
The Normalized Difference Vegetation Index (NDVI) is a spectral index used in remote sensing to detect photosynthetic activity and to estimate plant health. The near-infrared(NIR) and the red spectral bands are used for calculating NDVI, where high index values testify healthy and abundant vegetation. In contrast, low NDVI values indicate vegetation under stress or sparse vegetation (Fig. 2). The NDVI is based on the fact that the vegetation reflects much radiation in the NIR range and absorbs radiation in the red range. When the plant is stressed, the NIR values drop, whereas the red values increase, and thus the NDVI values decrease. It is, therefore, possible to use NDVI values to characterize crops’ phenological cycles, differentiate between various crops, detect an early stress, describe plant and crop health, and more. In the current research, the NDVI index was chosen to characterize phenological cycles of field crops at the Shikma Farm in the northern Negev region in Israel.
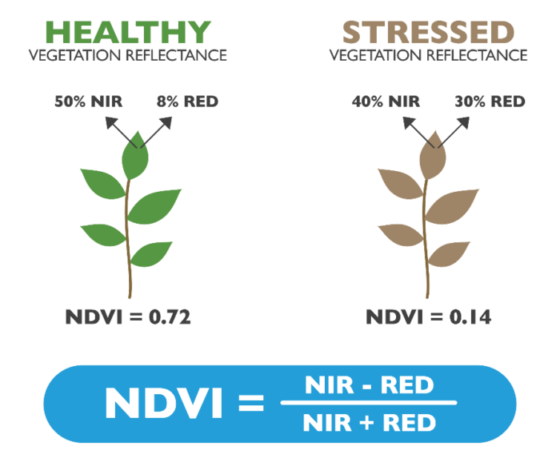
Figure 2: NDVI Index Definition
The VENµS satellite’s mission
The Vegetation and Environmental Monitoring New Micro-Satellite (VENµS) satellite was launched at the beginning of August 2017. It is a joint venture of the Israeli Space Agency (ISA) and the French National Center for the Study of the Outer Space (CNES). The primary scientific mission of the satellite is to provide frequent time series of plant characteristics, especially for precision agriculture uses. In order to realize this mission, the satellite’s imaging system is characterized by a high spatial resolution of 5 m/pixel, a spectral resolution of 12 bands in the visible and NIR wavelengths, and a high revisit time of once in two days in a constant viewing angle. VENµS up-to-date images are ready to use one day after observation. Data from the satellite has been accessible since November 2017 for scientific purposes. Integrating specific satellite capacities turns it into an efficient vehicle for many uses related to precision agriculture.
The research region
Use was made of a sequence of NDVI time series of VENµS during three years in three farms of Shikma fields clusters, situated at the north-west Negev region (Fig. 3): Beit Kama, (16 sq. km). Mishmar Hanegev (13.9 sq. km), and Migda (2.2 sq.km). This region’s climate is semiarid, with a mean annual precipitation of ca. 250 mm rainfall. A high spatial frequency variance, seasonal segregation, and intra-annual inconsistency characterize this rainfall. A part of the irrigation of the fields in the farms is based on precipitation, whereas other fields are connected to irrigation systems. The main winter field crops include wheat, barley, potato, and carrot. The main summer field crops are watermelon and paprika.
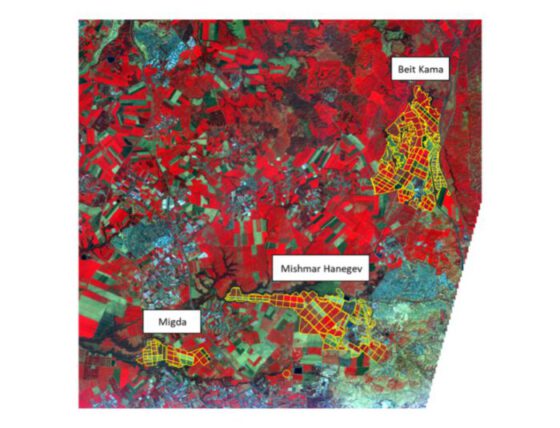
Figure 3: The Research Region Determined from the VENµS Satellite Image, obtained on 9.2.2018.
Color Legend: red color-active agricultural plots; green color -exposed plots (soil); grey color –urban area;
Methods
The high revisit time of the VENµS satellite, with an integration spatial resolution of 5 meters, form a particular time series of spectral data in terms of NDVI. Data about the crops were provided by Shikma and included irrigation data, plots’ names, crop type in each field, sowing and harvesting dates, crop use, etc.
Results
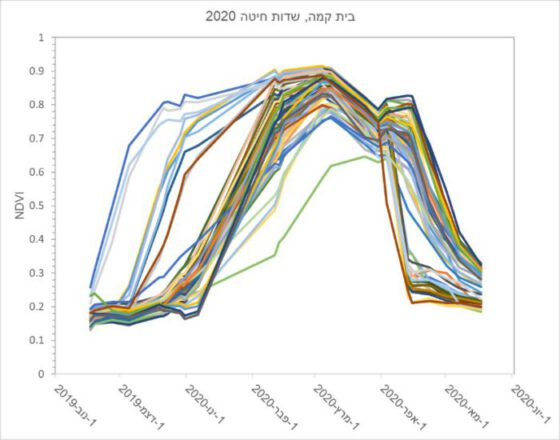
Fig. 4 presents a time series containing NDVI data of more than 60 wheat plots in Beit Kama from 2019-2020.
Figure 4 legend: the horizontal axis presents the NDVI measurement date (month/year) of more than 60 wheat plots at Beit Kama, beginning (from left to right) on 1.11.2019 and ending on 1.6.2020. The vertical axis presents the NDVI values measured.
During the emergence and harvesting period, it is evident that a high variance existed between wheat plots. Still, during the heading period, a lower variance exists in NDVI values between the plots. In addition, during the harvest period, wheat plots are harvested at different periods (depending on the crop use: silage, hay, grain). NDVI data makes it possible to characterize phenology to each crop and thus discern types of crops based only on VENµS images. Phenology characterization makes it possible to detect inconsistencies in different crops caused by pathogens, drying, a lack of nutrients, damage caused by pesticide use, etc.
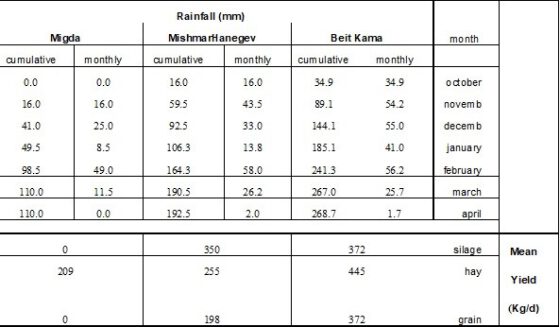
The integration of the VENµS time series with the mean monthly precipitation in each farm demonstrates the effect of the rainfall on the crop’s phenology. Thus, Mishmar Hanegev and Migda Farm are close geographically (ca. 20 km. apart). However, it is evident that there exists a variance in rainfall precipitation during the 2018-2019 season. Table 1 presents the importance of the effect of rainfall at the beginning of the growing season on wheat phenology in rain-fed plots in the three farms. In Beit Kama the highest rainfall occurred in November/December, less in Mishmar Hanegev, and the lowest rainfall quantity occurred in ‘Migda’. The crop distribution according to use (silage, hay, grain) appears in Table 1.
Summary
Innovations concerning remote-sensing use in precision agriculture have occurred rapidly in recent years. Satellite images have significantly improved in the frequency of imaging and spatial and spectral resolutions. These innovations make it possible to discern various crop characteristics concerning nutrients, water, pests, diseases, and more. There is great potential for precision agriculture integrated with remote sensing archives and real-time data in that this integration may improve modern agricultural farm management.
Acknowledgements
Data analysis of the project was done with the help of Asaf Vanunu and Micha Silver, staff members of the Remote Sensing Laboratory, Institutes for Desert Research, Ben Gurion University. Field data was provided by the Shikma staff.
*https://cris.bgu.ac.il/en/organisations/jacob-blaustein-institutes-for-desert-research-bidr