Satellite Imagery-A Valuable Aid to Farmers in Spotting Vegetation Changes in their Fields
Harel Greenblatt* harelg@shaham.moag.gov.il, Ministry of Agriculture and Rural Development

In the course of the last few decades, satellite imagery has become a valuable tool in providing information in many domains. One of its many uses is in agriculture. The purpose of this short article is to give a summary of its development and to explain its use and value to farmers.
Today, many companies offer methods to provide access to vegetation indices like NDVI among others, of which NDVI (Normalized Difference Vegetation Index) is one of the most commonly used: it is often quoted in the literature on many research projects. The NDVI was developed after the launching of the Landsat1 satellite in 1973 and has been used since then as a tool to identify and quantify areas with vegetation. During the past few years, the mechanization and technology department in the extension services at the Ministry of Agriculture in Israel has developed a number of websites which allow anyone to get information without any payment whatsoever and with no need to register.
Until the information that is today made available through the use of NDVI, farmers were unable to see variance in their fields without being physically present. Today, it is easy for a farmer to spot the areas with robust vegetation and those where growth is poor and be able to plan a tour of the problematic areas only.
The following websites have attracted a few dozen regular users, mostly farmers but there are also some researchers and commercial companies benefiting from their use.
NDVI time-series (animation) websites:
ForDesktop: https://harelg25.users.earthengine.app/view/ndvi-animation
For Smartphone: https://harelg25.users.earthengine.app/view/ndvi-m
The websites are very friendly and easily accessible worldwide. All that a user needs to do is focus on his area and change the date. The layer will then automatically update.
These websites are based on Sentinel 2 satellites which have a 5- day revisit and a spatial resolution of10 meters which gives 10 pixels in a dunam (or 100 pixels in a hectare). Due to the size of the pixel, these websites are considered the most suitable for field crops, row crops and other crops which are not grown under cover. In each of the websites, there is a slider that enables the user to move easily between images, making it easier to see patterns of growth. Today, although other satellites are available, some with better temporal and spatial resolution, for NDVI monitoring, the Sentinel 2 is still considered the best because access to the data is free and easily obtained.
The main disadvantage with the use of these satellite-based websites is the effect of clouds and shadows. A user may need to wait until the skies are clear. Problems with clouds and shadows can easily be spotted by switching to the “natural color” layer.
The image below shows how easy it is to see if there are clouds.
.jpg)
The websites enable comparison of crops in different periods of time. Users of the facility are able to view images even from two years earlier. If information on a field with high vegetation or one where growth is low is needed, the NDVI mini –maxi values in the settings can be changed enabling variance in that field to be seen more clearly. This is illustrated in the following image which shows how variance in a field appears after a change in the NDVI min-max values in settings.
.jpg)
The best practical illustration of the usefulness of these websites has come from farmers. Here are two examples.
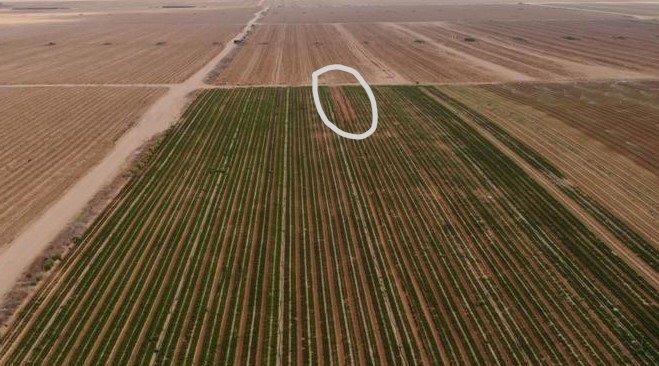
1. The three images which follow show a celery field with the tracks of a sprayer. The vehicle had run over the vegetables to avoid getting stuck in the mud.
In the first picture, we see the field as it appeared to the photographer, that is, to the human eye.
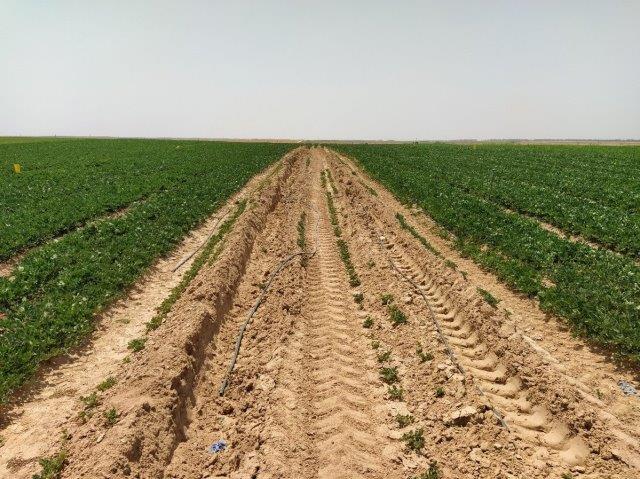
In the second picture, we see the image of the two beds through the eyes, as it were, of a drone.

Finally, in the third picture, we see the view of the two beds from a satellite.
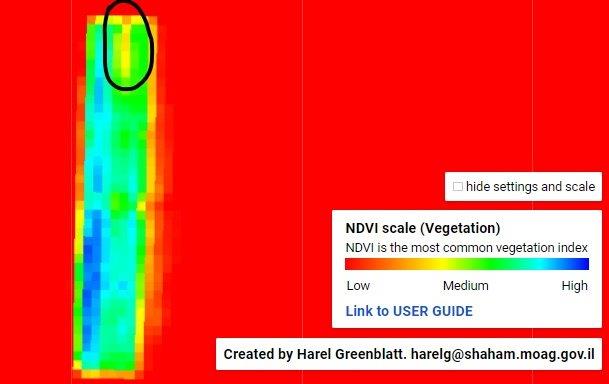
The three images almost speak for themselves, making clear the connection between NDVI and the state of the actual vegetation in the field.
2. In this example, the farmer provided an image of a peanut field showing poorer vegetation on the south-eastern side as a result of an irrigation problem. The farmer noted that the problem had not been spotted on a regular routine tour of the field.

The author would be happy to give advice or to deal with queries:
*Harel Greenblatt, harelg@shaham.moag.gov.il
Mechanization and Technology Instructor, Extension Service.
Ministry of Agriculture and Rural Development, Israel.
References: Wikipedia, ESA website