 |
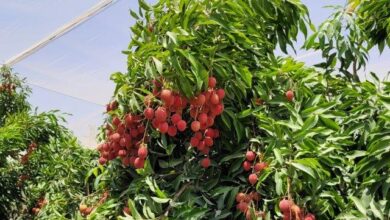
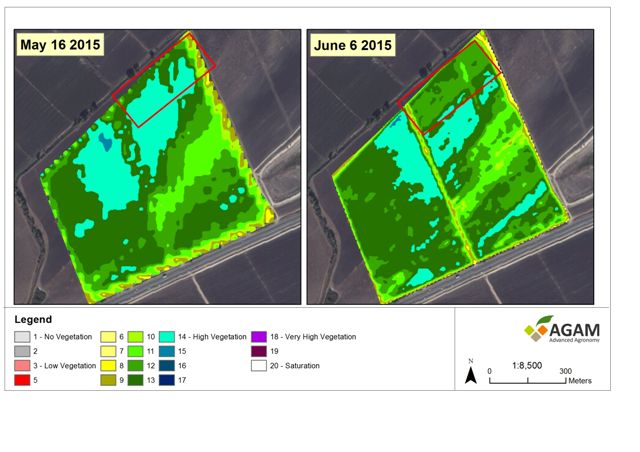
| Picture 1 – the red rectangle shows the ‘thirsty area’ |
Remote Sensing defined as the practice and technologies that enable collecting, analyzing and monitoring land data without any physical devices on the ground. It is a well-known practice in many different scientific domains such as weather, ecological studies, natural resource management, geology, forestry and more. It is also becoming more popular and accessible for agricultural purposes.
The use of a wide array of advanced sensors, mounted on platforms such as satellites, airplanes and Unmanned Ariel Vehicles (UAVs), coupled with data analysis technologies, provide agri-businesses stakeholders with information and knowledge they couldn’t possess before. In this short article we will share just a taste of real-life examples for how this information can serve farmers in their quest for production optimization, while saving on input costs.
Irrigation failure, as seen from space
One of the common techniques in Remote Sensing is analyzing crop growth by looking at vegetation levels – the NDVI (Normalized Difference Vegetation Index) can measure plant biomass that indicate plant activity. In a routine farm monitoring using satellite imagery analyzed for NDVI, a large cotton grower who uses drip irrigation, spotted a section with less vegetation compared to the rest of the field (see picture 1). The rectangular shape of the suspicious area suggested that there is something wrong in the irrigation of the area. Sure enough, the farmer found a broken irrigation valve and an irrigation controller that failed to alert him. He was able to recover this section and impact his top line of the same season.
What’s wrong… These trees are too strong!
In a Citrus orchard farm, the owner and his Agam’s agronomy consultant noticed an area with stronger vegetation compared to the rest of the orchard. It was deep inside the plot so the owner with the naked eye couldn’t have noticed the phenomena. But a unique method of putting NDVI layer from satellite image onto an aerial image with higher resolution (that separates the trees and rows) helped him, as seen in picture 2.
After navigating to the exact spot with a mobile app that shows the image and uses GPS, the grower realized that due to topography there is variability in the soil depth and structure that impacts the growth. This variability, once mapped, can be treated with different levels of fertilization and irrigation in order to save costs and improve crop health.
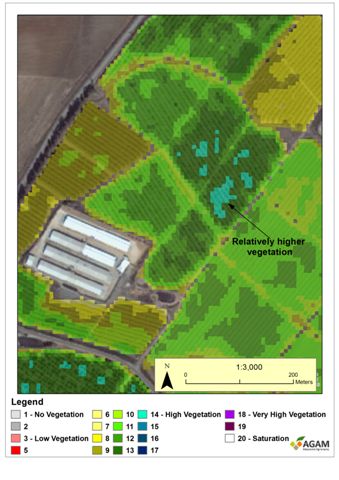 | 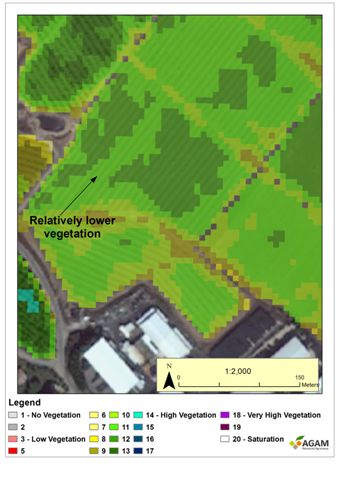 |
| Picture 2 – The light blue spots represent relatively higher vegetation. | Picture 3 -Lighter green shows lower vegetation levels |
The cheap rows
In the same farm, an Avocado grower was concerned about a few struggling trees in his orchard. He looked at a satellite image with NDVI and realized that indeed there is a problem, but not with just a few trees but in two weak rows. In this case the root cause was tracked back to the health of the seedlings used in these rows. The grower will treat these rows differently, continuously monitor the orchard with remote sensing and even considers replanting.
There are many other use cases of applying remote sensing to the field – detecting Nitrogen levels, crop dryness, identify and map crop types and more. We in Agam Advanced Agronomy specialize in connecting the most advanced remote sensing technologies to farmers and help them interpret the data so they can optimize their agro-performance.