Fertilization impacts both crop yield and soil greenhouse gas emissions, although not consistently

Ilya Gelfand igelfand@bgu.ac.il
French Associates Institute for Agriculture and Biotechnology of Drylands
Jacob Blaustein Institutes for Desert Research, Ben-Gurion University of the Negev
Globally, agricultural soils are responsible for ~30% of global nitrous oxide (N2O) emissions 1. Potent greenhouse gas (GHG), N2O has ~300 times stronger radiative forcing effect than carbon dioxide (CO2) 2. Agricultural soils are source of the N2O due to intensive management and nitrogen (N) fertilization used by farmers to maximize yields3. Israeli farm soilsare not an exception. Highly industrialized, high input/high yield farming in Israel, using large quantities of fertilizers (https://tinyurl.com/ghgcbs.gov.il). The major difference between Israeli agricultureand other countries with industrialized agricultural practices, is the widespread application of fertilizers through drip irrigation (fertigation = fertilization + irrigation). Fertigation delivering nutrients close to the target plant in small quantities and was shown to have lowerenvironmental effect (e.g. GHG emissions)than when fertilizers applied at the beginning of the growth season4,5. Till recently, however, emissions of N2O from agricultural practices in Israel were rarelymeasured6 and actual amounts of emitted GHG from Israeli agricultural practices are currently unknown.
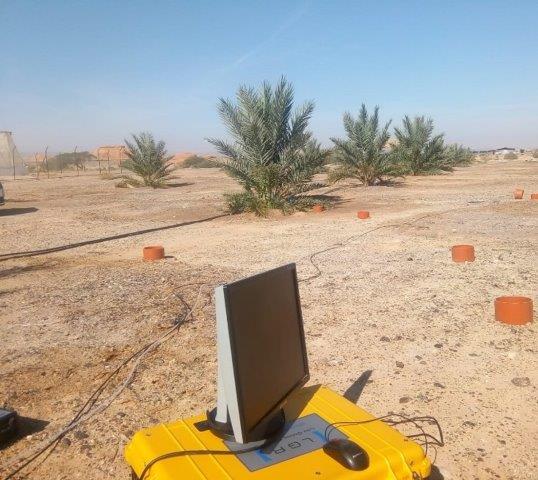
To close this knowledge gap, two field experiments with increasing N fertilization levels were carried out. Both experiments had a non-fertilized control, which is important if we want to know background GHG emissions from the agricultural soils, i.e., from soil under a given crop which is not receiving fertilizer. The first experiment was performed in ayoung date palm(Phoenix dactylifera L., cv.’Medjool’) orchardin theAravavalley.
The date crop was chosen due to two reasons; Firstly, there is no information on environmental effects of dates cultivation in Israel and elsewhere, while dates are an important agricultural commodity. Secondly, date orchards are fertilized with an average rate of ~700 kg N ha-1 year-17. Such a high fertilization rate could result in a very high soil N2O emissions 8 however emissions from the date orchardswere never measured.
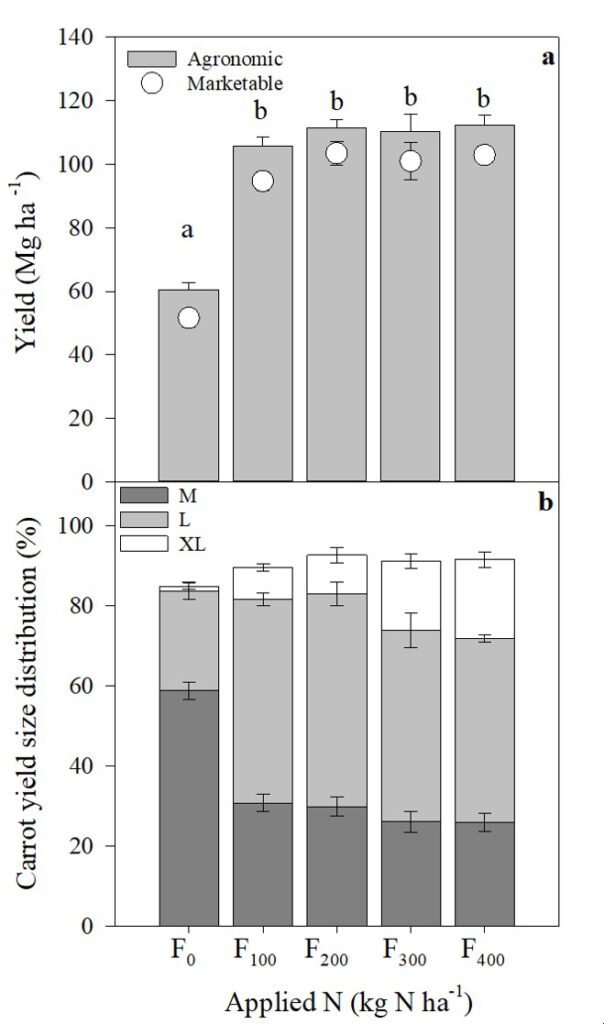
Figure 1. Fresh yield (a; bars) and marketable yield (a;opensymbols) all in mg fresh yield ha-1, and fresh yield size distribution (b; %); medium (M), large (L), and extra-large (XL) for carrots grown under different fertilization regimes, mean ± s.e. (n = 5), statistically significant differences indicated by lowercase letters (ANOVA; F 4,25 = 45.6, p <0.05).
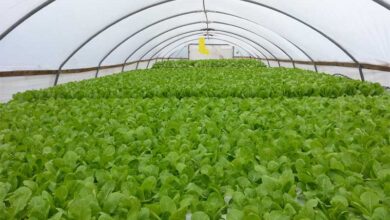
The second experiment was designed to study the effects of increasing fertilization rates on the yield and soil N2O emissions fromthe carrotplot in the Northern Negev. Carrots are an important root crop in Israel and elsewhere, intensively managed and fertilized. Carrots produced in Israel are exportedto the EU during the winter months and locally consumed during the summer9. High fertilization rates, up to ~180 – 250 kg N ha-1 season-1 of the carrot crop may have a negative effect not only on the environmental impact of the crop, but also on the ability of Israeli farmers to sell the yield to the EU, currently aiming to reduce GHG emissions10.
Both experiments had a similar structure, as we used replicated plots with increasing fertilization rates, including unfertilized treatments. And measured bi-weekly soil emissions of N2O and soil temperature, water content, and inorganic N pools. Yield quantity and qualityweremeasured at the end of the growing season. In the date orchard, in addition to N2O fluxes, we have measured nitrate (NO3-) leaching usingchloride(Cl-) balance 11. Soil N2O emissions were measured using the static chambers method12 using high-precision, newly developed quantum cascade laser(GLA151N2OM1, ABB, Quebec City, QC, Canada) capable ofmeasuringvery low concentrations of N2O 13. The setup used for field measurements allowed us to measure even very low fluxes (emissions) of N2O with high confidence. The yield was manually and mechanically harvested, weighed, and N concentrations in the fruits/carrots were measured in a CHNS/O analyzer (FlashSmart Elemental Analyzer, Thermo Fisher Scientific Inc. Waltham, Massachusetts, US).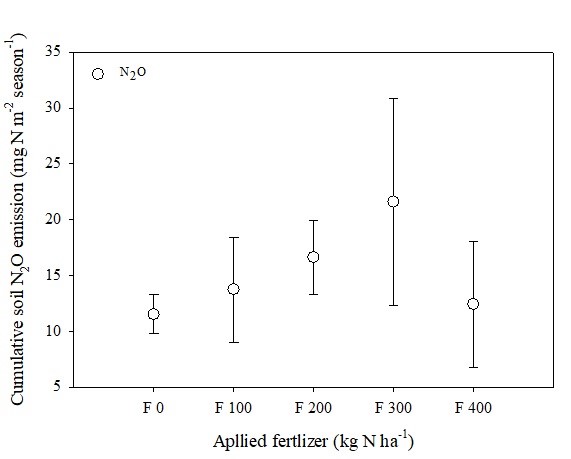
Figure 2. Effect of increasing N fertilization levels (zero to 400 kg N ha-1or F0 – F400) on soil cumulative emissions of N2O (mean ± standard error, n = 4; mg N m-2 season-1). No statistical differences were found.
The two studied crops were very differently affected by fertilization and their GHG emissions and other environmental impacts were different. Surprisingly, the carrots yieldwas notaffectedby increasing fertigation; the only difference we found was between unfertilized and fertilized plots (Fig. 1a). Size distribution of the yield, however, was affected, as higher fertilization caused larger taproots (Fig. 1b). Soil emissions of N2O were also the same across all fertilization levels and didn’t differ from the background (Fig. 2). Potential explanation of these results is the high efficiency of the N uptake by the crop (Table 1) due to precise drip fertigation.
Table 1. Seasonal N balance (kg N ha-1) and agronomic efficiency (kg yield kg-1 N) of carrot crop (mean ± standard error (s.e.)n = 4). 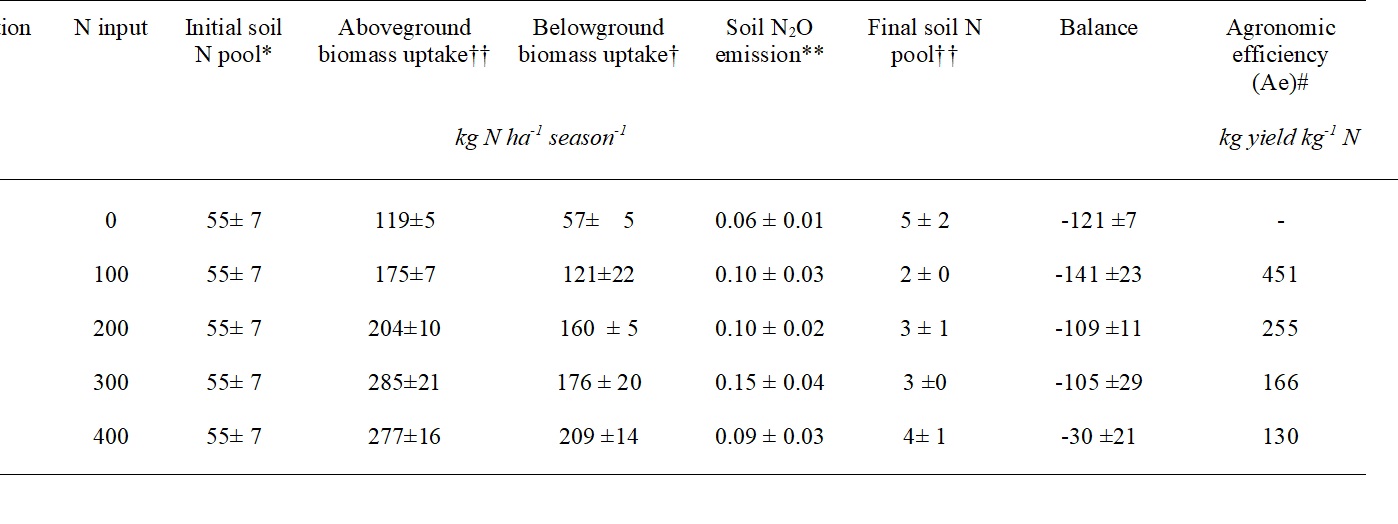
* Soil inorganic N pool measured after initial seedbed formation ~four weeks before sowing.
** Cumulative soil N oxides emissions for the N balance estimation calculated until the day of harvest.
† Based on dry mass; Carrot water content was 86.48±1.05% and was not affected by fertilization levels.
†† Soil inorganic N pool measured at harvest before tillage of seedbeds, not included in the net N balance.
# Calculated based on the agricultural fresh yield;AE (kg yield × kg-1 N applied) = (Y_X- Y_0)/N_F ; where: NF is N fertilizer applied (kg N ha-1), YXis the yield in a specific fertilization treatment, and Y0 is the yield in the unfertilized treatment (kg fresh yield ha-1).
Dates exhibited different response and soil N2O emissions dynamics to increasing fertilization. Soil N2O emissions increased little with increasing fertigation rate and had a threshold response once fertigation reached 2.5 kg N tree-1 year-1 (Fig.3a). Nitrate leaching exhibited very similar dynamics (Fig.3b), exponentially increasing toward ~50% of added N at fertilization of 2.5 kg N tree-1 year-1. Yield, which is managed in the date orchardstowards maximizing quality (i.e., size) by pruning doesn’t change (Table 2), but fruits had slightly higher N concentration (Table 2).
Table 2. Annual N uptake* to fruit (seed + pulp) and leaflet tissues of the date palm (mean ± standard error; n = 3-4), fruit and new frond production, and subsequent N use efficiency parameter.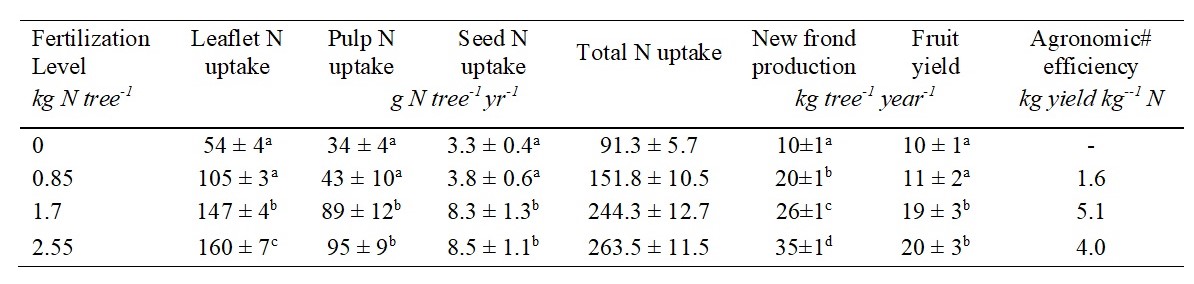
*Significant differences in leaflet N uptake (ANOVA: F 3,11 = 77.5, p <0.0001), pulp and seed N uptakes (ANOVA: F 3,12 = 10.99, p < .001; F 3,12 = 9.34, p < 0.01, respectively), new frond mass (ANOVA: F 3,11 = 64.98, p <0.0001), and fruit yield (ANOVA: F3,12 = 5.52, p < 0.05), represented by different lowercase letters.
# Calculated based on the agricultural fresh yield;AE (kg yield × kg-1 N applied) = (Y_X- Y_0)/N_F ; where: NF is N fertilizer applied (kg N ha-1), YXis the yield in a specific fertilization treatment, and Y0 is the yield in the unfertilized treatment (kg fresh yield ha-1).
Measured low soil GHG emissions are intriguing. Israel, as part of the OECD is responsible to report its agricultural GHG emissions. Current practice in Israel is to use IPCC (Intergovernmental Panel on Climate Change; an international initiative aiming at understandinghumans’ impact on the planet) Tier I/II emissions factors which are related to the fertilization rates14,15. Current reports, based on high fertilization rates,potentially overestimate soil N2O emissions. This is because based on the results of our research, measured emissions are as small as 10th of the estimated using the IPCC methodologies. These are good news for Israeli farmers. Widespread use of fertigation, possiblyresponsible for such low GHG emissions from Israeli agricultural soils and farmers can assure potential consumers that Israeli agricultural produce has a low GHG footprint (i.e., climatic) impact.
Nitrate leaching, on the other hand, while not affecting global climate change, is posing a local water quality threat. Increasing fertigation seems to cause large NO3- leaching (Fig. 3b) causing reduced water quality in Israel16. Accumulation of NO3- in Israeli aquifers alreadyresulted in reduced water quality standards of ~70 ppm NO3- vs 45 ppm in OECD countries. This problem, however, at least partially was solved by prevalent use of desalinized water as drinking water supply.
Overall, our resultshighlightthe importance of field-based estimation of environmental (and climatic) impacts of agriculture. Field measurements are expensiveand difficult but essential.
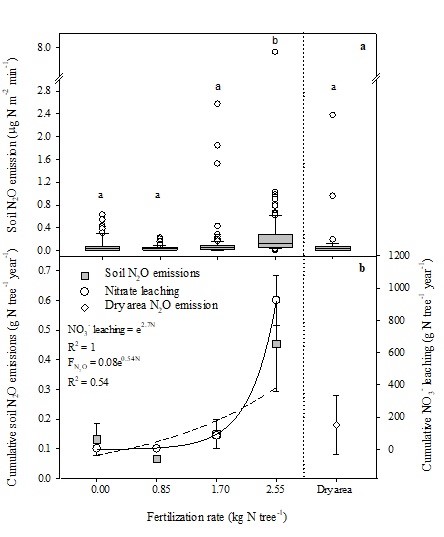
Figure 3. Effect of increasing fertilization levels on soil N2O emissions from the area around the tree and emissions from the “dry areas” between the palm rows (n = 4 individual static chambers; seasonal averages).Significant differences(F: χ24,11 = 25.33, p < .0000) represented by different lowercase letters (a). Effect of incremental N fertilization on cumulative soil N2O emission (g N tree-1year-1; left y-axis) and cumulative NO3- leaching (g N tree-1year-1;right y-axis) (b). Cumulative soil N2O emissions from the “dry areas” are shown to the right of the dashed separation line and were not part of the fertilization treatment. Emissions for the “dry areas” are calculated on the same areal basis as emissions from the area around the tree. The area around the tree is 3.14 m2 (mean ± s.e.; n = 3 replicated palm trees). It was not possible to measure leaching in the “dry area.” Note that the y-axis scale changes between different panels.