Calibration of a seasonal wheat yield forecasting system for Israel in times of climate change
Yotam Menachem(1,2)* yotam.menachem@mail.huji.ac.il | Roi Ben-David(3)* Avimanyu Ray(1,2)*Ehud Strobach(2)*
1. Introduction
Climate change is predicted to impact world agriculture and food security significantly (Anderson et al., 2020). In Israel, a semi-arid region characterized by a cold and wet winter and a dry and warm summer, climate change is expected to pose a significant risk to agricultural sustainability (Haim et al., 2008). Wheat (Triticum sp.) is themost widely grown crop in the world (Awika, 2011; “Wheat Improvement,” 2022). Similarly, wheat is the most widely grown crop in Israel with over 110,000 hectares (43% of all agricultural land). The prevalence of wheat is made possible by its ability to grow in most regions of the country, from the rain-saturated north (over 1000 mm per year) to the semi-arid south where precipitation is scant (less than 200 mm per year). Israel’s wheat is a dual-purpose crop yielding about 190 thousand tons of grain and about 900 thousand tons of fodder for feeding animals. Due to the high cost of water, vast majority of wheat fields are rain-fed(Israel Central Bureau of Statistics, 2021) causing productivity fluctuation between seasons according to annual rainfall(Shiff et al., 2021).
The interest in crop yield forecasting models has been increasing in recent years due to their potential capability andability to predict the expected yieldunder changing climate. This prediction is important for a wide set of applications such as supporting agronomic decision-making,agro-system and crop management, strategic planning for crop improvement as well as for studying the potential impacts of future climate on food security. Given the specific environmental conditions, crop models predict plant growth and development, as well as potential yield, by simulating physiological processes in the plant.Dynamical models, sometimes called process-based models, utilize differential equations to depict the development of crops and simulate their growth over time. These models include many input parameters and often require physiological data from field experiments to define those parameters (Kasampalis et al., 2018).
One recent development in crop modeling relevant to this research is the integration of crop models within climate models. One such example is the Noah-MP soil model, whichwas coupled recently with a crop model (Noah-MP-Crop) and later integrated as part of the Weather research and forecasting (WRF) atmospheric model. The crop model includes mathematical representations of dynamical growth processes for allocating photosynthesized carbon to different crop parts during the growing season. Also, the model calculates the time-varying leaf Area Index (LAI), which in turn directly affects photosynthesis, evapo-transpiration, soil moisture, surface radiation and surface energy fluxes (Liu et al., 2016).The integrated modeling system (WRF coupled with Noah-MP-Crop) provides a potential modeling system for improved seasonal wheat yield prediction. Yet, several gaps in the crop model needed to be explicitly addressed specifically for spring wheat varieties grown in Israel. Hence, this study aims to calibrate wheat crop model dependent physiological parameters,based on commercial fields monitoring.
2. Methods
2.1 Observation Sites and Experiments Design
In the initial research phase, we collected and created a database from nine representative fields throughout the 2022-2023 wheat-growing season (Figure 1).The fields are located in three sub-regions: the southern Shfela,the northern Negev, and the northwestern Negev, Israel’s main wheat growing area. These sampled fields represent different growing environments, seasonal climate variability, varietal composition (the commercial cultivars ‘Omer’, ‘Gadera’, and ‘Gadish’), and different farms with different agronomy protocols.All wheat fields selected for this research represent 1st season of wheat in crop rotation. Additionally, all fields, except one, are rain-fed.
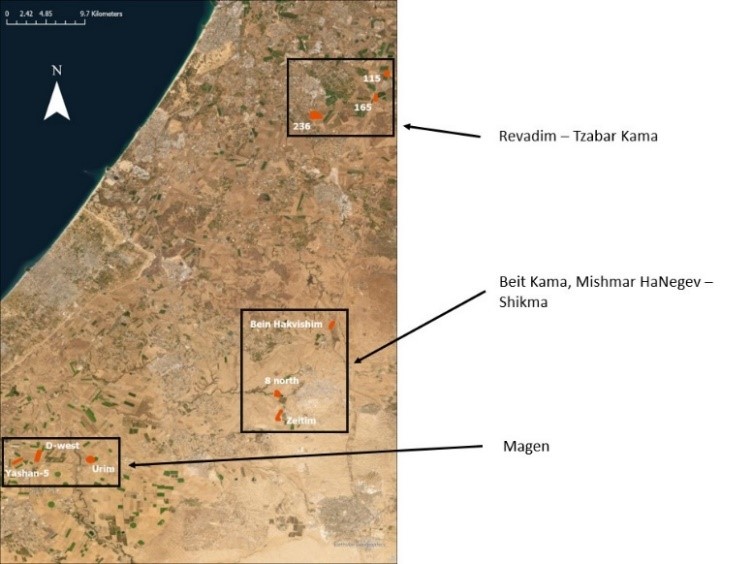
Figure 1:(A) The fields characterized in this study and their spatial distribution.
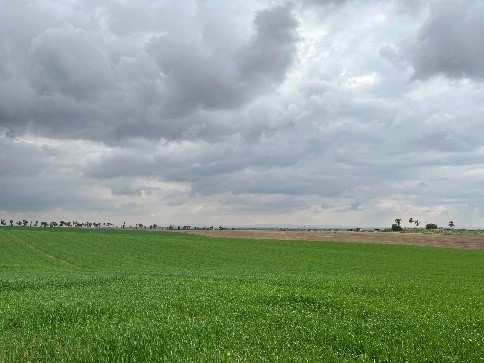
(B) One of the research fields located in Revadim.
During the growing season each field was visited once in two weeks. We defined the phenological stage on each visit according to the Zadoks scale (Zadoks et al., 1974).
Additionally,upon each field visit, we randomlysampled quadrats (0.0625m2) of wheat plants by removing all above-ground vegetation. In total, nine samples per field visit were collected in order to represent spatial variability as much as possible. The samples then dried at 65°C for 72 hours and dry weight was measured.Ground Leaf Area Index (LAI) measurements were made throughout the growing season with SS1 SunScan Canopy Analysis System(Bréda, 2003). In addition, we calculated the number of growing degree days (GDD) accumulated between each phonological stage using data from the nearest meteorological station. GDD is a measure of the number of hours the surface air temperature was above a certain threshold (0 degrees for wheat).
2.2 Field sampling of the Noah-MP-Crop model parameters
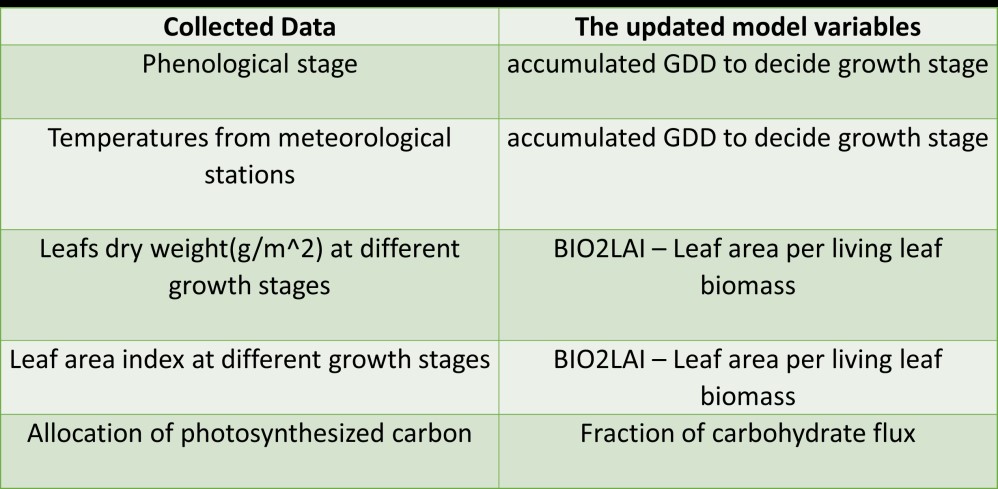 Chart 1:Field observations and corresponding model parameters.
Plants require a specific amount of degree-days accumulation at each developmental phase (Miller et al., 2001), which means that the phenology development of the crops depends on temperature. Crop models usually use accumulated GDD to describe crop growth stages. We defined five key growth stages for wheat: 1. Tillering, 2. Stem Elongation, 3. Heading, 4.25 days after heading, 5. Maturity. Accumulation of GDD dictatesthe length of each growth stage, which, in turn, affects the allocation of carbohydrate fluxes to different plant parts, respiration, turnover, and senescence rates that vary in different crop growth stages (Figure 2).
In this model, the leaf density in the field is a major factor in field-atmosphere interactions. The Leaf Area Index (LAI) (m2/m2) is calculated by multiplying the leaf biomass (LFMASS) (g/m2) by the BIO2LAI (m2/g) parameter,which represents the leaf area per unit of living leaf biomass. BIO2LAI converts leaf mass into LAI in the Noah-MP-Crop (Chart 1). This study optimized BIO2LAI using LAI and LFMASS observations.In the field, BIO2LAI varies among different crops and varieties,and changes during the growing season. However, in this model, it is assumed that the value of BIO2LAI is constant for the entire growing season. This assumption is common in many studies of crop modeling (Liu et al., 2016).
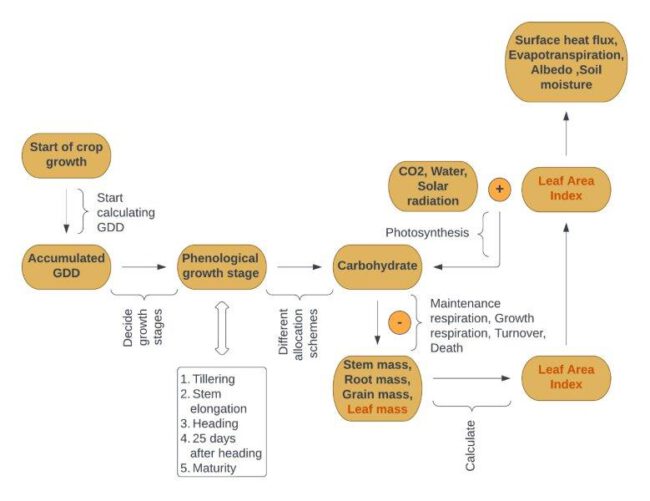
Figure 2: Flow chart describing the Noah-MP Crop model. The red markings emphasize the significance of the Leaf Area Index (LAI) and Leaf Mass in the calculation process and simulations(Liu et al., 2016).
2.3 Initial Simulations
We conducted initial simulations of previous years using parameter values adjusted to Israel’s wheat commercial fields to understand the magnitude of their influence on the output. Furthermore, we compared the results with yield data received from local farmers.
3. Results
3.1 Field measurements
The current growing season (2022-23) was characterized by an irregular distribution of precipitation during the season, with significant spells of drought periods and high temperatures. All sampled fieldswere sown from the middle to late November. December 2022 was a dry month, resulting in late emergence and drought stress during the early development stages in some of our sampled fields. This late emergence has caused significant variation between fields in crop developmental phases and biomass accumulation.On the other hand, it allows the collected data to be usedto compare the variability of climatic conditions and, consequently, crop development.Field observations will be conducted in the following two seasons, allowing us to assess the robustness of the current results.Initial results (Figure 3) indicate similarities between the fields that emerged before the drought. Field 8-north, which was sown late,emerged after the rain returned at the end of December and suffered from low canopy cover (Figure 4).
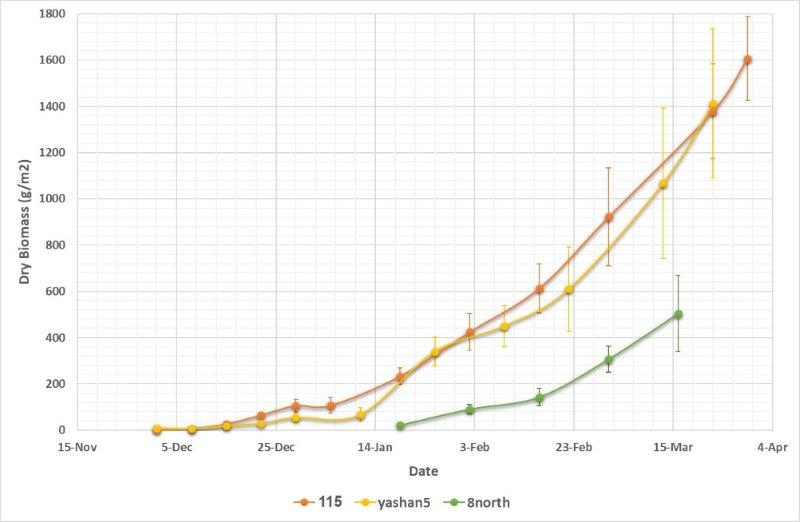
Figure 3:(A)Dry biomass measured in three fields throughout the growing season. Field 115 – Revadim with the cultivar ‘Gadish’, Field Yashan5-Magen with the cultivar ‘Gadera’, Field 8 – north – Beit Kama with thecultivar ‘Omer’.

(B) Analysis of variance of three fields biomass 60 days after emergence.
Figure 4: Field 8-north – Beit Kama was sown on 24/11/2022 andsuffered from late emergence(emerging date was 01/01/2023). The field had low biomass with a lack of canopy cover and low plants.
3.2 Initial simulations of the coupled model
To illustrate the importance of the field observations to calibrate model parameters, we have conducted a set of simulations using the WRF model coupled to the Noah-Mp-Crop model. The crop model parameters in this case were determined from literature and previous studies on Israel’s wheat cultivars. Simulation results using these parameters indicate lower yield values than those measured in commercial fields. However, they can simulate the spatial variability of wheat yield in selected locations across Israel (Figure 5). Future analysis of field observations will allow us to adjust the model parameters further.
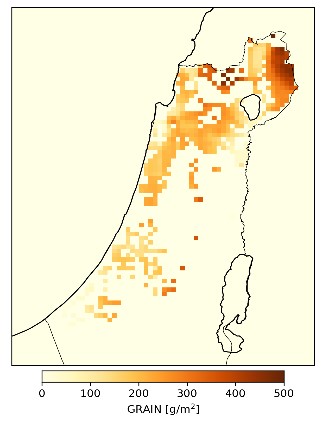
Figure 5: Initial output of the coupled model simulation for the 2016-2017 growing season.
4. Conclusion
Initial simulations of the WRF model coupled to the Noah-MP crop modelwere conducted over the past few years. However, we found that the yield values obtained did not correspond to the yield data values measured in previous seasons by the local growers. Moreover, simulations with different parameter values showed different results and helped us understand which parameters to focus on in this initial research phase. Results also suggest that the calibration of the parameters in the Noah-MP Crop model significantly influences the model’s output. To address this issue, we plan to continue collecting data throughout the current season and analyze it at the end of the season. The new data collection will enable us to make an initial calibration of the crop model parameters, which will help us run the model more accurately. Doing so will allow for an in-depth examination of the various effects of the parameters on seasonal crop forecasts.
*(1) The Robert H. Smith Faculty of Agriculture, Food and Environment, The Hebrew University of Jerusalem, Rehovot 7610001, Israel
*(2) Department of Environmental Physics and Irrigation, Institute of Soil, Water and Environmental Sciences, Agricultural Research Organization (ARO) – The Volcani Center, RishonLeZion 7505101, Israel.
*(3) Department of Vegetables and Field Crops, Institute of Plant Sciences, Agricultural Research Organization (ARO) – The Volcani Center, RishonLeZion 7505101, Israel.