Key Factors Affecting Dairy Farm Profitability in Recent Years
Wafa Deabat-Shahbari* wafas@shaham.moag.gov.il, David Biran, Yoav Shaani*
Introduction: Economic analyses have been conducted in recent years in commercial dairy farms. They aim to reflect an up-to-date economic view and to carry out an analysis according to different characteristics of the dairy farm. The purpose is to point out the factors that can bring about an improvement in the profitability and efficiency of the dairy farm. In the last year’s most of the commercial dairy farms have been analyzed identically, as concerns the data collection method and its analysis. This situation allows for the analysis of results based on objective, fundamental characteristics.
This study aims to examine the factors that influence the profitability of dairy farms in the last 5 years. The database contains results of economic analyses of 71 different commercial dairy farms. The analysis consisted only of farms that carried out an analysis during all 5 years. Table 1 depicts the distribution of the farms according to nutrition source and farm size (according to quota size in a farm).
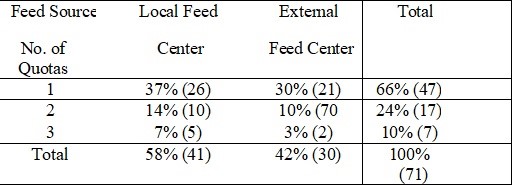
Table 1: The Distribution of the Examined Dairy Farms According to Size and Feed Source Characteristics
Professional indexes: In an all-year examination (2019-2023), there was a continuous rise in the mean milk yield per cow. In 2019, the yield was 11,700 liters per cow, and reached 12,140 liters per cow in 2023. In addition, there was a mild rise in fat and protein percentage during this period: 3.80%-3.97% in fat, and 3.42%-3.47% in protein.
Expenses components: The mean cost of the production of 1.0 liter of milk in the above-mentioned years, reaches 1.93 IS per liter (the yearly mean ranges from 1.73 IS to 2.16 IS per liter). The nutrition component is the major expense among the different expenses’ items – 65%- and the mean expenses on nutrition during 2019-2023, is 1.25 IS per liter of milk. The nutrition cost ranges from 1.06-1.46 IS. The main reason for the increase in food cost is the ongoing Russia- Ukraine war. The cost of nutrition differs between farms, according to its nutrition source: in local feed farms its cost is significantly lower than its cost in farms which acquire it from external feed centers. However, no difference was found in the cost of this parameter between small-scale farms and large-scale ones. These data are displayed in figure 1.

Figure 1: average cost for feed per liter in relation to food source and dairy farm size
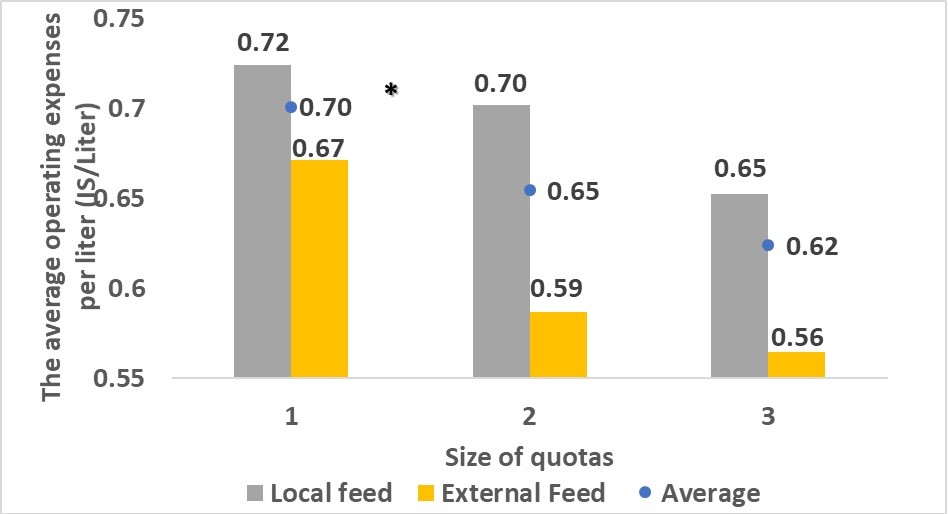
Figure 2: The average operating expenses (materials, services and labor) in dairy farms, according to food source and dairy farm size
*Indicates statistical significance at P<0.05, using the Tukey-Kramer test.
Revenues: The mean revenue for 1 liter of milk, during the years 2019-2023, was 2.34 IS. This amount is in a rising tendency, beginning with 2.13 IS per liter of milk in 2020, till 2.6 per liter of milk in 2023. There was no significant difference in the revenues per liter of milk between farms with local feed centers or from farms which acquire nutrition from an external feed center. However, the revenues in double- and triple-quota farms are higher in 0.04-0.05 IS per liter in comparison to single quota farms but this difference isn’t statistically significant.
Profitability: During the years of this study there were slight differences in operational balance. These differences are derived from different national production policy and different terms of trade along the years. From an analysis of the perennial database, it was found that there is no significant difference in the operational balance between the double-quota farms and the triple-quota farms, but there is a significant advantage between these two and the single quota farm which expresses itself in addition of 0.09 IS and 0.13 IS, respectively. In addition, it seems that there is a significant advantage of 0.08 IS/liter in average, in the operational balance in favor of farms with local feed centers, in comparison to farms which acquire nutrition from an external feed center. What’s more, it was found that this advantage among the single quota farms amounts to 0.09 IS/liter, in a significant manner, but no statistically significant difference was found among the large-scale farms.
According to the analysis we found an operational advantage in favor of large dairy farms (2 and 3 quotas) and of producing food in a local feed center on a single quota farm. To provide dairy farms owners with tools for decision-making in order to improve profitability, we conducted a feasibility study of investments. In examining the feasibility of investing in uniting two single quota dairy farms, it was found that the increase in the operating balance because of this uniting does not return the investment. But, in examining the feasibility of investing in an in-house feed center in a dairy farm with a single quota, it was found that the payback period is 12 years.
To summarize, a wide and a uniform database permits a fundamental and qualitative analysis. This study relates to 71 commercial dairy farms from different regions in Israel during 5 years. The analysis shows that there is an ‘economy of scale’ to efficiency in cutting down ‘operational expenses’. No significant difference was found as concerns the nutrition expenses between farms, according to sized based division. However, there was found a difference in nutrition expenses between farms according to nutrition source: there was an advantage in favor of farms with local feed centers. There is an advantage to the triple- and double-quota farms as concerns the operation balance in comparison to the single quota farms. In addition, there is an advantage in the operation balance in favor of the farms with local feed centers, in Below :
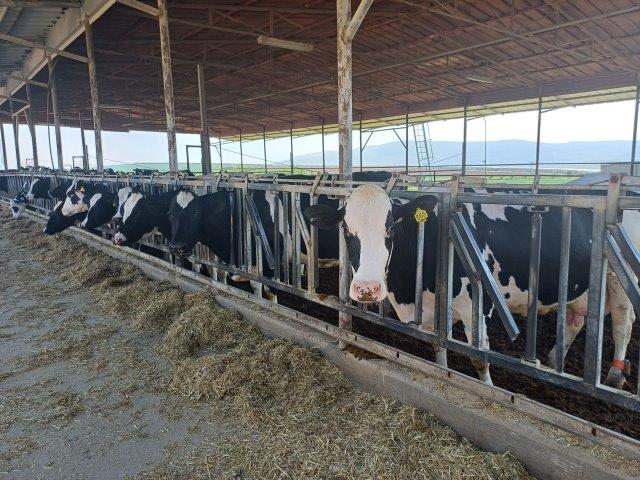
Photo 1 : Cows Feeding in a Dairy Farm
*Extension Service, Ministry of Agriculture and Food Security