Empowering Data-Driven Farming
Estimating Crop Water Consumption Using a Time Series of Satellite Imagery
Offer Rozenstein offerr@volcani.agri.gov.il and Josef Tanny*
we are using the latest innovations in satellite remote sensing to estimate crop water use and provide timely and consistent feedback to farmers. this information is crucial for efficient irrigation management and can inform practices that increase agricultural productivity and sustainability from small to large scale farms.
background
monitoring the changes of soil and crops status in agricultural fields throughout the growing season is key in increasing the production efficiency. as the crop develops from seedling to a fully mature plant, its transpiration changes accordingly, and so do the crop water requirements. in the early stages of the growing season, the majority of the evapotranspiration, which represents the combined water loss due to evaporation from the soil surface and transpiration from the crop, is attributed to soil evaporation. yet, as the crop develops, the relative contribution of transpiration to the evapotranspiration increases as the vegetation cover increases, and eventually declines with maturity and senescence. therefore, information about the daily crop evapotranspiration, can facilitate better irrigation planning, and ultimately, increase the water use efficiency.
the crop coefficient, which represents the crop water demand, is a useful and widely used approach for irrigation management. the crop coefficients have been shown to vary between sites and between seasons. additionally, in cases of atypical crop development and water-use patterns caused by weather anomalies, adopting recommended crop coefficient values often results in imprecise crop water use estimations. as a result, local adaptations to recommended crop coefficients are implemented to form local coefficient tables, but even these sometimes fail to capture deviations from standard conditions due to specific fertilization, variations in crop planting density, and stress factors such as pests. in addition, the spatial variation in crop water use due to spatial heterogeneity in soil characteristics such as water holding capacity and nutrients availability is not reflected in standard coefficient tables. accordingly, in the absence of reliable, real-time information about crop water use, there is a need for better crop coefficient estimates.
one approach to address this need is by using satellite remote sensing imagery. this technology is attractive for modeling crop water use since it provides a synoptic coverage at fixed time intervals, and can therefore monitor changes over time. moreover, spectral indicators derived from remote sensing imagery are highly correlated with crop characteristics including biomass, leaf area index (lai), plant height, and yield. similarly, these spectral indicators can serve as near-real-time surrogates for crop water use since they depict a similar temporal pattern. the reason for that is that both plant transpiration and light absorption increase roughly at the same rate throughout the growing season. in order to model the crop water consumption with satellite observations, we are performing evapotranspiration measurements in the field on the same days as the satellite overpass occurs. .jpg)
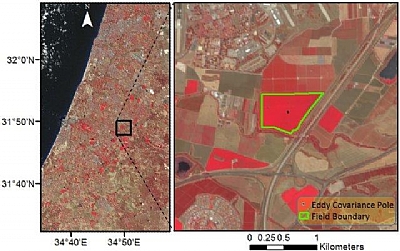
fig. 1. left: sentinel-2a false color regional image (rgb = bands 8,4,3) acquired on 25 july 2016. the black square represents the footprint of the image on the right, showing a blow-up of the area around the study site.
the basic limitation of satellite remote sensing application for irrigation management is the compromise between the sensor’s revisit time and spatial resolution. sensors with a short revisit time such as the moderate-resolution imaging spectroradiometer (modis) that provides daily coverage are characterized by a coarse spatial resolution (>250 m), while sensors with medium spatial resolution such as the landsat series are characterized by longer revisit times (16 days). cloudy conditions further reduce the temporal resolution for all optical sensors, thus posing another limitation on operational applications. irrigation management decisions for field crops should ideally be based on a dense time series of imagery that are fine grained enough to distinguish between field plots. commercial high spatial resolution satellite sensors are usually not employed for crop monitoring because their imagery are not public domain and come at a significant cost, rendering them too expensive for most operational agricultural applications. therefore, in spite of remote sensing models for crop water consumption, the limited availability of imagery with suitable temporal and spatial resolutions at no or low cost hindered the development of worldwide remote sensing application for near-real-time irrigation decisions.
the successful recent deployment of the two sentinel-2 satellites creates a unique opportunity for operational crop water consumption estimates. sentinel-2 multispectral spaceborne imagery with a 5-day revisit time (obtained by the combination of sentinel-2a and sentinel-2b data) can potentially create a dense observation time series at 10-20 m spatial resolution, which would allow the application of this technique even for small fields. sentinel-2 imagery offers an acceptable compromise between the revisit time and spatial resolution, with increased spectral abilities for vegetation monitoring compared to previous public domain spaceborne imagery. hence, the overarching aim of this research was to develop a methodology to estimate cotton water consumption based on sentinel-2 imagery. the key objectives of this study were to (1) estimate daily crop water consumption experimentally in the field, and (2) develop empirical models that link crop water consumption with remotely sensed spectral indicators from sentinel-2.
.jpg)
fig. 2: field measured water consumption for cotton in this study, and the standard recommendation by the israeli extension service (ies) for cotton growers in this region compared to estimates according to three models: (a) the model developed in this study; (b) kamble et al. (2013); (c) montgomery et al. (2015).
methods
the measurements took place during the summer of 2016 in a cotton field near gedera, in the shfela region in israel. direct measurements of actual crop evapotranspiration were done by an eddy covariance system that measures at high frequency the water vapour concentration together with the wind speed and direction (fig. 1). a total of seven relatively cloud free sentinel-2a images acquired during the cotton-growing season were analysed in this study, including five images that coincide with our agro-meteorological field measurements. we calculated 22 vegetation indicators based on different combinations of the unique sentinel-2 spectral bands. we then checked to see which of these spectral indicators is most related to the crop coefficient based on our field measurements of crop water consumption. in order to compare our findings with previous studies we estimated the crop coefficient according to relationships found in previous studies between the crop coefficient and a spectral indicator, and to the standard crop coefficient recommendations by the israeli extension service.
results
we found that most of the spectral indicators can be used to estimate the crop coefficient, but that the three best ones rely on the red-edge spectral bands, which are unique to sentinel-2. for the particular field in our study, the relationships that were found in other studies between spectral indicators and the crop coefficient grossly overestimated the crop water consumption that we measured in the field. the israeli extension service recommendation was also higher than the crop coefficient derived from the measured crop water consumption (fig. 2).
conclusion
sentinel-2 is superior to older generations of public domain satellite data in terms of spatial, temporal and spectral resolutions. this allows, for the first time, to estimate the crop water consumption, an important parameter for irrigation management, at a high frequency that can support irrigation decisions, at a fine spatial resolution of 10 m that well captures within field variability, and at higher accuracy than before, owing to the sensor’s unique spectral bands that cover the red-edge region.
*institute of soil, water and environmental sciences, agricultural research organization, volcani center